A Recommendation Report on Integrating Future Solar and Wind Energy Production into the United States Power Grid
Summary
As the United States continues to grow and the Earth continues to warm, transitioning the national power grid to a reliable, modern, environmentally-friendly system is paramount to preserving the American standard of living. As renewable energy resources are heterogeneously distributed across the United States, proper placement of renewable energy production facilities is necessary to ensure enough power is generated. In addition, the disconnected nature of the power grid presents further challenges to renewable power distribution. This report presents interactive mapping utilities showing current power plant capacities and renewable resource power generation capacity distributions for use in renewable installation planning. In addition, this report provides large-scale suggestions for modernizing the power grid in preparation for conversion to primarily renewable energy, including increased interoperability between the Eastern, Western, and Texas interconnections, development of an incentive structure for producing clean power for distribution to the rest of the grid system, and funding reseach into and construction of high-capacity energy storage plants. Furthermore, this report uses the developed mapping utilities to provide suggestions for multiple locations in which to install wind and solar power farms to alleviate the effects of pollution, reduce the economic impact of fossil fuel transportation, and provide clean electricity to power-hungry cities. Recommendations include increasing wind utilization in Dever, CO in order to shut down the dangerous Cherokee Power Plant and decrease pollution, increasing wind utilization in Eureka, CA for sale to cities like San Francisco, constructing solar farms in Salt Lake City, UT to augment and replace coal-burning power plants causing dangerous air pollution, and utilizing renewable energy in Honolulu, HI to decrease energy costs incurred by shipping petroleum products across the Pacific.
1 Introduction
No advancement has impacted human society like the advent of inexpensive, reliable power. It has become an indispensable part of our daily lives, controlling our communication, our transportation, our jobs, and even our health. In 2017, the United States generated 4.01 trillion kilowatt-hours (kWh) of electricity to power its nearly 137 million homes, charge the cell phones of its 325 million people, light the 26.5 million streetlights lining its roads, and connect its 200 million Internet-enabled devices [1]. Only 11% of this energy came from sources classified as “renewable:” solar, wind, geothermal, hydroelectric, and biomass [2]. As the Earth continues to warm, the United States is being pressured to decrease its environmental impact due to fossil fuels, and thus is investing considerable resources into research and development of efficient alternative energy sources. In contrast to fossil fuels, many renewable power sources are dependent on geography. Geothermal and hydroelectric sources are localized to specific sites, such as rivers and volcanic hotspots. Wind and solar energy, though available throughout the United States, have different capacities for power generation depending on geographic features that make the technology more or less appropriate for the location.
This report aims to detail the current state of the art of wind and solar energy production and provide recommendations and tools for further integration of solar and wind energy sources into the U.S. power grid. Although there currently exist many solar and wind farms throughout the continental United States, new policy and consumer demand for alternative energy sources will encourage construction and integration of next-generation solar and wind farms. This report will provide intuitive, interactive visualizations of solar and wind capacity distributions, as well as the current locations and capacities of the existing U.S. power plants.
1.1 The U.S. Power Grid
The United States power grid is divided into five interconnections: the major Eastern and Western interconnections, and the minor Texan, Alaskan, and Quebec interconnections [3]. Each interconnection is semiautonomous and capable of distributing power to its region of service with no input from other regions; however, a small number of high-voltage lines and variable-frequency transformers tie the grids together to allow for limited load sharing. Each interconnection was developed somewhat independently, and though they share the same nominal voltage (120V, later converted to 110V for consumers) and AC frequency, they are generally not interoperable, as frequencies are not in the same phase across regions. Interconnections are run by multiple regional utility companies called “balancing authorities” that are linked together in each region and supply power to a small portion of the grid.
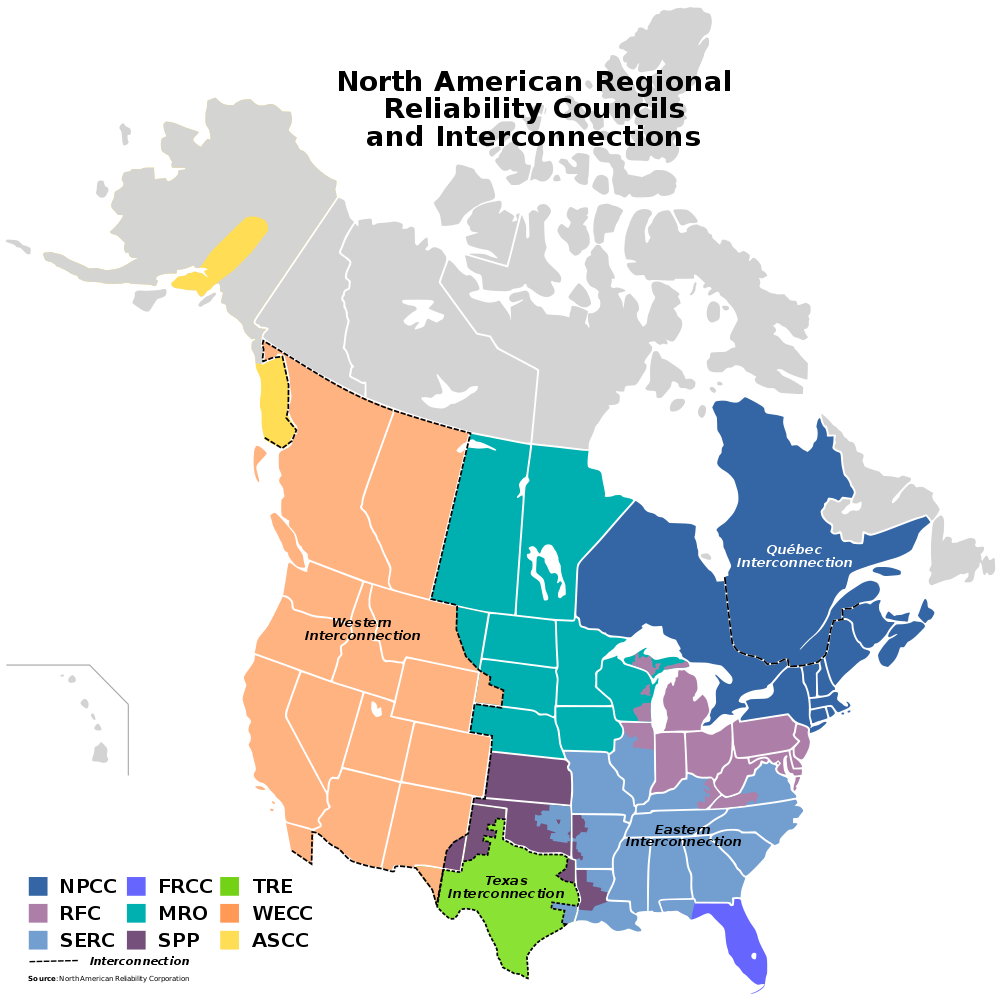
Figure 1: North American interconnections. The three largest interconnections are the Western Interconnection, (orange), the Texas Interconnection (green), and the Eastern Interconnection (teal, purple, blues), which is governed by multiple reliability councils. Source: Wikimedia Commons
The United States power grid began organically as multiple small utilities began supplying local areas with power in the late 1800s, but it was not until the 1920s that these companies began to link their power networks together. In 1934, Congress passed the Public Utility Holding Company Act, which classified electricity as a public good of importance and set up regulatory authorities to oversee the operations of regional power utilities. It was not until 1992 that Congress passed an Energy Policy Act, which required transmission line operators to allow open access to their network. This created competition within the electricity market by allowing more distant companies to transmit on the same network as a local company, driving prices down. Eventually, competitive pressure transformed the power companies from monolithic entities that entirely controlled generation, transmission, and distribution into separate companies that handled each phase independently. In an attempt to promote interoperability, power companies came together to form electric reliability councils and corporations to oversee the various regional power utilities in their areas. The largest of these, the North American Electric Reliability Corporation (NERC), was founded in 1968 and continues to oversee all interconnections of the continental United States that are operational today. However, due to the organic growth and late regulation of the United States power network, as well as geographical and political challenges, the grid is aging and difficult to maintain. Today, customers in the US experience blackouts 285% more often when compared to 1984, with severe weather events accounting for around 70% of all major outages [4]. According to the Lawrence Berkeley National Laboratory, every year the US loses $26 billion to sustained power outages and $52 billion to momentary power outages, for a total loss of $76 billion per year. As the demand for continuous energy availability increases and the US becomes even more dependent on constantly-available power, losses due to power outages will continue to rise. In addition, the current grid system is vulnerable to attack by foreign adversaries. In 2017, hackers were able to gain operational control of a few US power companies. A similar attack in Ukraine disrupted power to 250,000 people [5]. Due to these issues, policymakers and citizens have called for a revitalization and modernization of the US power grid and the creation of a “smart grid,” which integrates digital technology for intelligent load balancing and forecasting, as well as more efficient transmission and distribution.
1.2 Renewable Energy Technology
One of the core tenets of the “smart grid” effort is the incorporation of renewable energy technology into the power network. In 2017, around 11% of the US energy production came from fossil fuels; 2.4 percentage points of this portion come from wind power, 0.77 points come from solar energy, and the remainder came from hydroelectric, geothermal, and biomass sources [2]. Though capable of generating large amounts of power, hydroelectric and geothermal energy sources can only be harnessed in specific places of the US, and biomass sources still produce greenhouse gasses and pollution when burned. Therefore, this report will focus primarily on the placement and integration of new solar and wind farms.
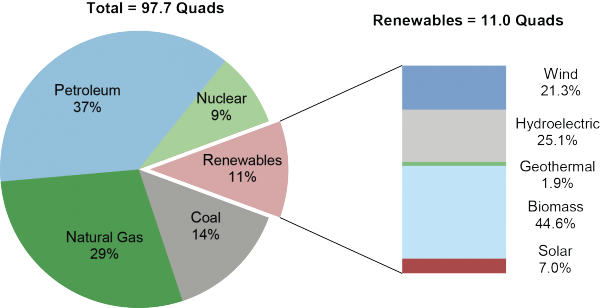
Figure 2: Chart detailing energy source percentages in the US. Source: University of Michigan Renewable Energy Factsheet.
1.2.1 Solar Power Generation
A 2012 report by the National Renewable Energy Laboratory estimates that solar power could viably provide almost 400,000 terawatt-hours of electricity, over 100 times the annual consumption of the entire country, making solar power the energy source with the most potential out of all current methods of production [6]. Currently, 53 gigawatts of solar photovoltaic modules are installed in the US in 2017, generating 0.77% of the nation’s total energy. This was a 30% increase in installed capacity over the previous year, making it the fastest-growing segment of renewable energy technology. In addition, costs of photovoltaic cells continue to drop: from 2009 to 2019, the cost of solar panels dropped over 60%, from $850/watt to $3.05/watt [7]. This price drop is driven by continuing increases in the efficiency of solar photovoltaic cells (up to 44.5% efficiency) and sustained global investment in solar energy.
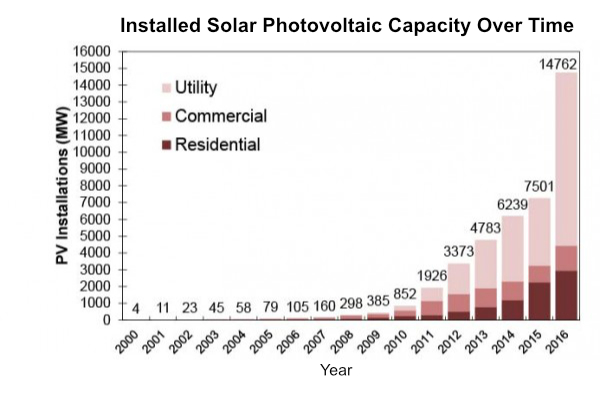
Figure 3: Installed photovoltaic capacity over time, broken down into utility, commercial, and residential capacity. Source: University of Michigan Renewable Energy Fact Page.
At a basic level, a photovoltaic solar cell generates electricity by absorbing energy from sunlight and converting it to electricity. Each cell is generally small, from half an inch to around 4 inches across, and produces only 1-2 watts [8]. In the typical solar panels seen on buildings and in solar farms, anywhere from tens to hundreds of these photovoltaic cells are connected to form a photovoltaic (PV) array, capable of supplying a useful amount of power. As PV cells gather energy from the sun, they perform best when in direct sunlight and perpendicular to the sun’s rays. Several strategies exist for maximizing the energy-gathering potential of solar panels, from complicated systems of mirrors to rotating mounts that automatically track the sun’s movement.
PV cells are generally efficient, inexpensive, and easy to install. They produce no emissions and can easily supply enough power for residential use with careful power budgeting. However, PV cells also come with several notable downsides. They are formed from silicon wafers, and thus require specialized manufacturing processes; the doping process also requires heavy, toxic metals that can cause environmental damage if they are released into the ecosystem. The most notable downside is the temporal inconsistency of solar energy. Weather conditions, day length, cloud cover, and pollution can all affect the amount of power generated on any given day, and no power is generated at night. This temporal inconsistency leads to spikes and deficits in the power produced, which the current power grid cannot handle, and may result in unavailability of electricity to consumers if unfavorable conditions persist.
1.2.2 Wind Power Generation
In 2017, over 50,000 wind turbines supplied 82.1 GW of power to the United States and US territories. Onshore wind resources can generate an estimated 11,000 GW of power, 123 times the current production limit. Turbines generate no emissions and require little oversight, making them ideal for less-populated rural areas. Though wind power generation is bolstered by a production tax credit, the one-time costs associated with wind turbine construction and continued maintenance costs equate to a 5-8 cent per kilowatt-hour price, according to a 2012 report, making it cost-competitive with fossil fuel power generation, and fourteen states now produce over 10% of their power from wind [9].
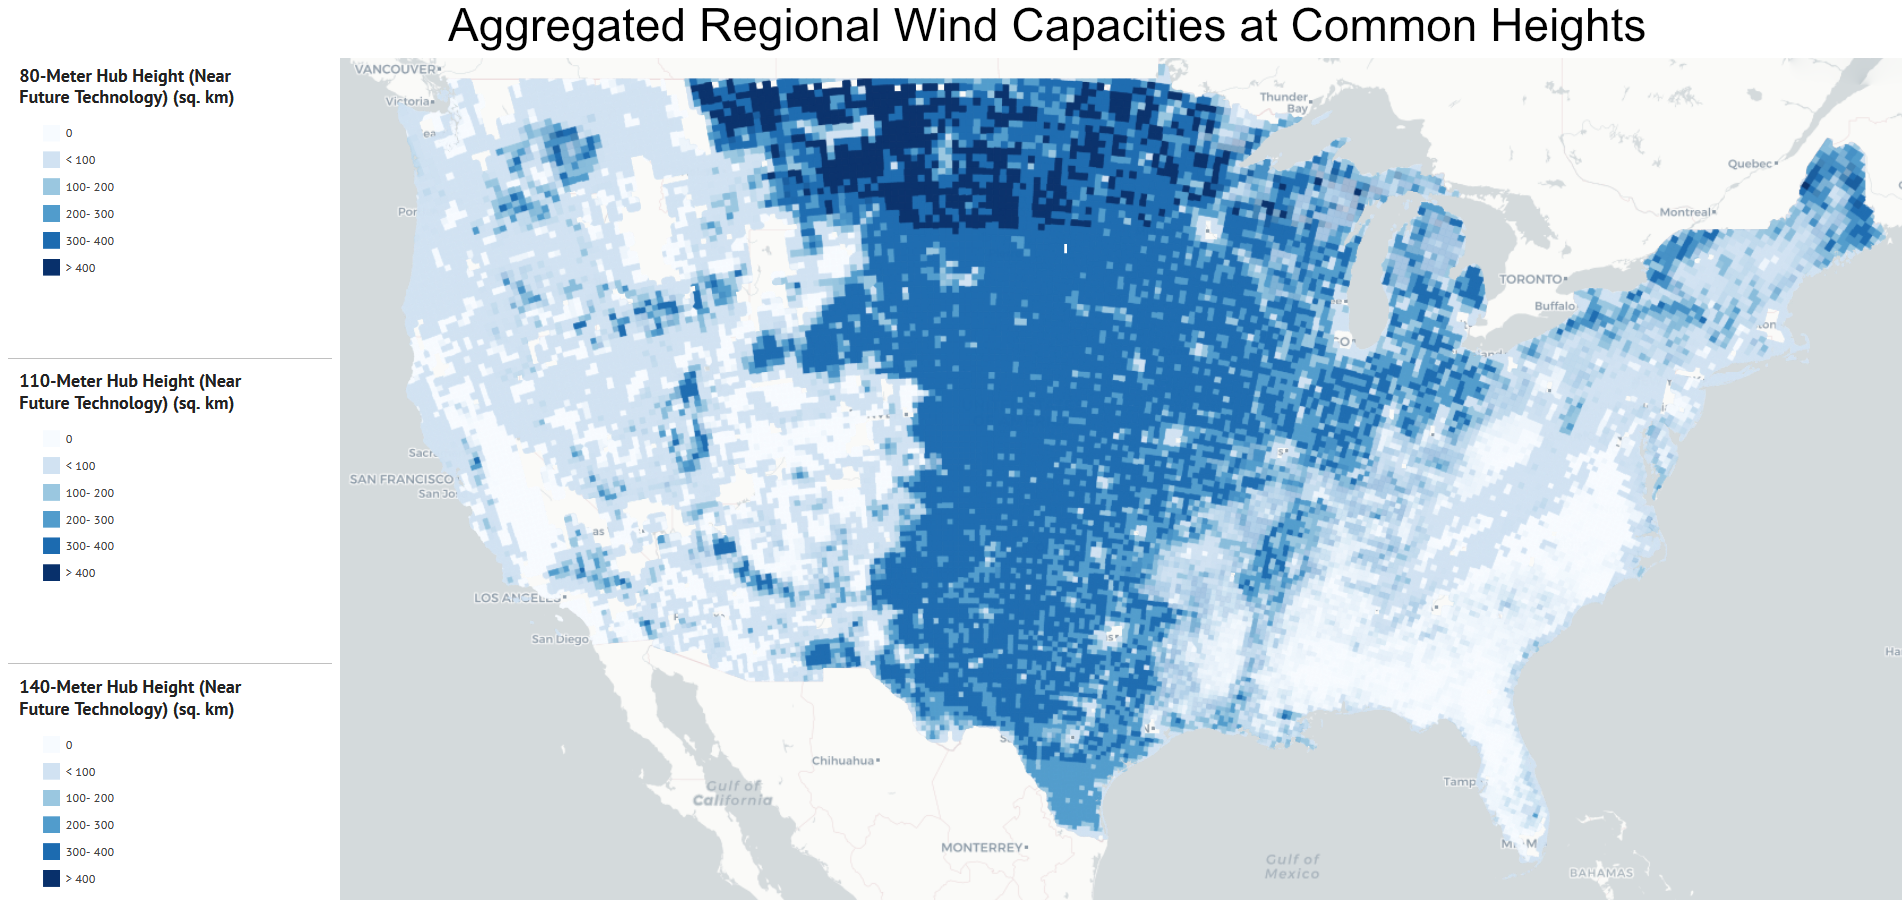
Figure 4: Aggregated modelled wind capacity factors at commonly-used wind turbine heights. Source: NREL Wind Prospector.
As seen in Figure 4, wind capacity is centrally distributed in the United States, with the largest amount of production capacity located along “Tornado Alley” – a region of the central United States from the Texas panhandle to Montana. Other regions in the northwest continental United States also have a high capacity, especially in Washington and Oregon. Offshore wind resources could also generate an additional 4150 GW of power to supply highly populous coastal cities with clean power.
As with solar power, the largest obstacle to wind power adoption is the temporal inconsistency of power generation. Wind strength and consistency is also affected by weather patterns, season, and time of day. Although wind currents are stronger and more consistent higher in the atmosphere, most current industrial models are generally around 80-100 meters tall for structural stability, though heights and sizes continue to increase [10].
1.3 Renewable Energy Distribution
Given the temporal inconsistency of renewable power generation, the largest engineering challenge is how to distribute power when it is needed instead of when it is produced. The demand for power is not constant; even in ideal conditions, power use still fluctuates throughout the day.
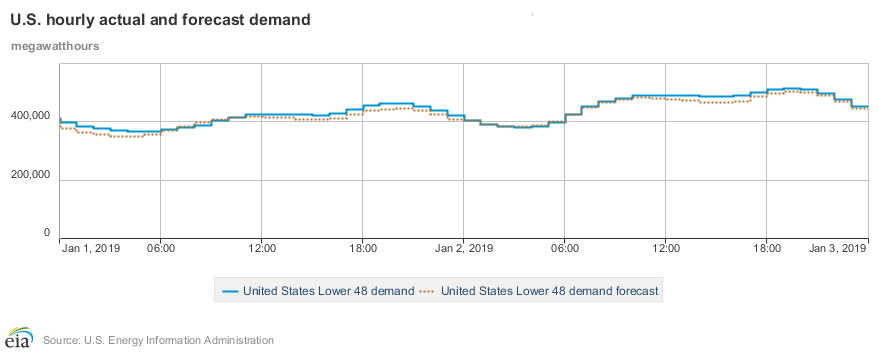
Figure 5: United States hourly and forecasted demand for one day. Times in EST. Source: US Energy Information Administration.
On a small scale, this challenge is relatively easy to overcome. For example, PV arrays on residential and commercial building generally are equipped with a battery unit, which charges using the excess generated electricity during the day and releases energy at night. Wind power is generally more consistent, but also employs battery technology to even out to peaks and troughs in power production. Although this solution works very well for small loads, it faces issues of scale when applied to an entire country. Battery choice today involves tradeoffs between efficiency, longevity, and capacity. The batteries most commonly used in cell phones and electronics, lithium ion polymer (LiPo) batteries, have a high capacity and the best discharge rate of any commercially-available battery, but degrade over time -- they should be replaced every 5-10 years, while solar arrays can last up to 40 -- and are expensive. Classic lead-acid batteries are cheaper, but much larger per watt than LiPo batteries and have a decreased lifespan. Although new battery technologies are being developed such as saltwater batteries, no commercial or industrial solution currently exists. This technology is being further extended into microgrids: small, independent, local power grids capable of generating and distributing power to a small set of local customers. However, this technology is not widely implemented, and current implementations generally serve only one customer, such as a hospital or university.
On a larger scale, many power utilities have experimented with energy storage. In 2018, the US had slightly over 25 GW of energy storage, compared with over 1000 GW of production capacity [11]. Current technologies for power storage include batteries as well as pumped hydroelectric storage, compressed air energy storage, and flywheel storage. However, energy storage is not widely implemented and is generally only used on short time scales. Much more energy storage capacity will be needed to offset the temporal instability of renewable resources.
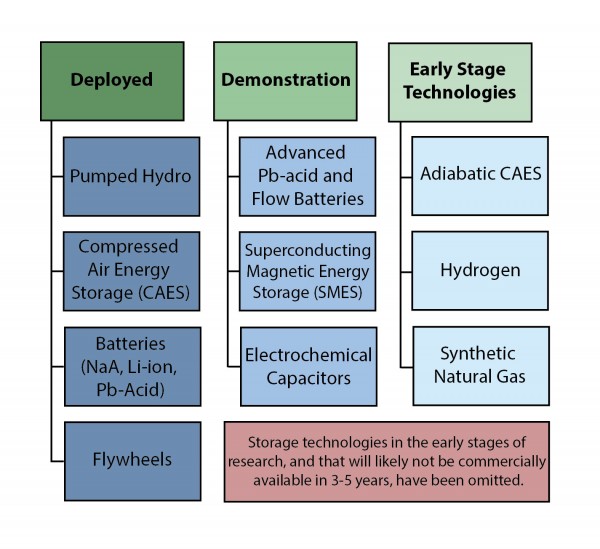
Figure 6: Outline of deployed and in-development energy storage technologies in the United States. Source: University of Michigan Energy Storage Fact Sheet.
2 Analysis of Solar and Wind Capacity Data
2.1 Data
This report uses data from multiple sources, surveys, and studies in order to generate figures and make recommendations. A large portion of this data comes from studies conducted by the National Renewable Energy Laboratory (NREL) and NREL contractors.
2.1.1 Solar Irradiance Data
Solar irradiance data were obtained from NREL’s Solar Resource Data API, including Global Horizontal Irradiance (GHI), a measure of the total solar energy received by a flat, horizontal surface, which provides an upper limit on the energy able to be produced by a solar panel (assuming zero loss and 100% efficiency). Therefore, GHI provides a measure of a region’s production capacity of solar energy: regions with higher GHI will be able to produce more energy per unit PV cell than regions with lower GHI. Average GHI obtained from the NREL API for a certain location is calculated by averaging hourly measurements of GHI over a 12-year period from 1998-2010.
2.1.2 Wind Capacity Data
Wind capacity data were obtained from the NREL wind prospector, a tool for exploring wind datasets [10]. Specifically, this report combines results from the Eastern Wind Dataset and the Western Wind Dataset. The Eastern Wind Dataset reports capacity factors for a variety of datapoints across the northeastern United States, stretching from North Dakota down to Oklahoma and eastward to Maine. This dataset contains capacity factors for putative wind farms generated from wind speed data sampled at 10-minute intervals from 2004-2006. The model and final report were created by AWS Truepower with oversight by NREL. The Western Wind Dataset is similar to the East Wind Dataset, but on a much larger scale, containing 1.2 million datapoints with modelled capacity data for over 34,000 of these points. The dataset was created by 3TIER using the Numerical Weather Prediction (NWP) model with data sampled every two minutes from 2004-2006. As the datasets used different scales for the capacity factors, which do not correspond to actual energy outputs, the datasets were rescaled in the following way: first, all datapoints with the same 5-byte geohash (equivalent to being within 2.4 km of each other) were sampled from each dataset. Then, for each set of points with the same geohash, the points are separated into E and W, the subset of points coming from the East and West Wind Datasets, respectively. The average capacities of E and W were then computed, and their ratio W/E was computed. After this was done for each shared hash, the median of these ratios was computed and used as a scaling factor (see Figure 7).
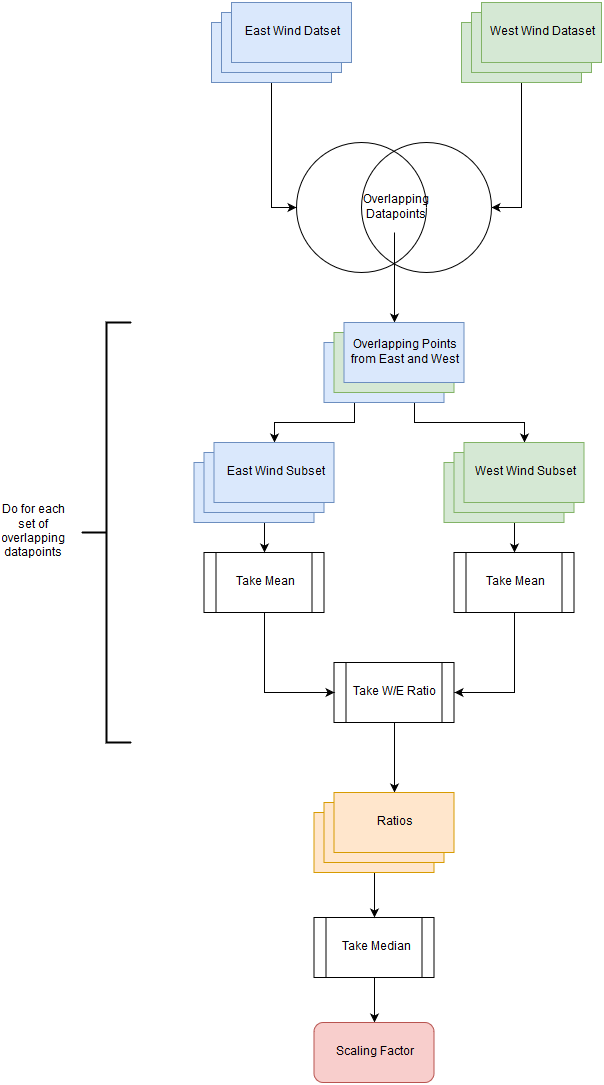
Figure 7: Flowchart depicting process of determining the scaling factor for the Eastern Wind Dataset.
2.1.3 Power Plant Capacities
Power plant capacities were obtained from the Energy Information Agency Form EIA-860M, which reports the status of operating and proposed electric power generators on a monthly basis. This report used the most recently available data, from December 2017, and extracted the nominal nameplate capacity value in MW from each generator. Generators were then aggregated by site to produce an estimate of the normal operating power generation capacity for each power plant.
2.2 Data Distributions
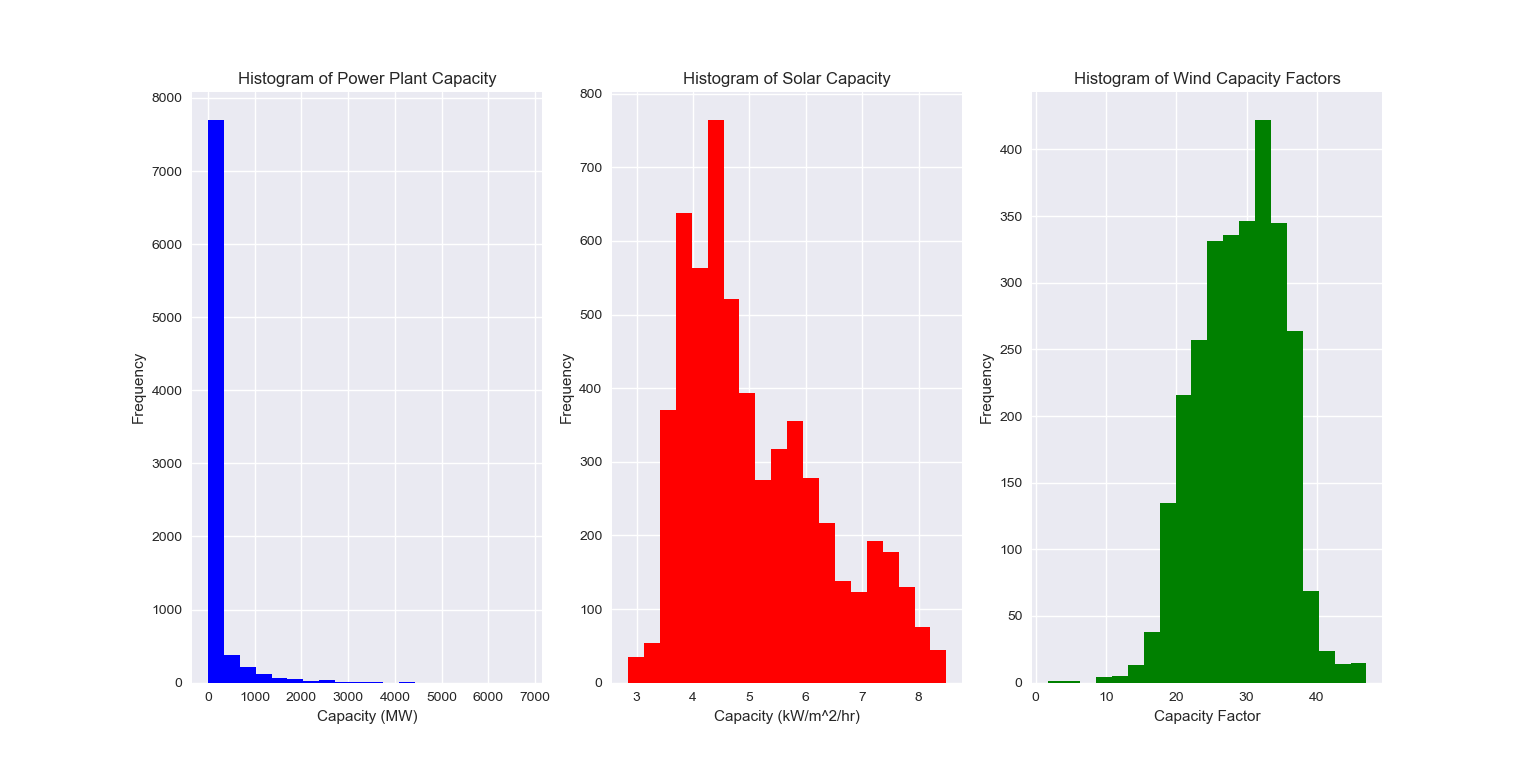
Figure 8: Histograms of power plant capacity, solar capacity, and wind capacity. Data source: NREL/EIA.
Figure 8 shows the distributions of the capacities of manmade and natural power resources. Power plant capacities (blue) show a large majority of plants produce under 500MW, with only a few larger plants. Wind capacity (green) is roughly normally-distributed, while solar capacity (red) appears to be more variable.
2.3 Mapping Toolset
To aid interpretation and exploration of the data, interactive maps were created using Plotly and Mapbox [12]. These plots are embedded here, but the full set of features (including zooming) is avalable on the Plotly website. These maps also support exploration of the data using the mouse cursor, export to PNG, and data table previews. For charts with multiple datasets, clicking on the legend toggles the dataset on and off for the reduction of visual clutter and better interpretability of the data. Zooming in gives a more granular view of the data and allows exploration of individual datapoints. Code used to generate the interactive figures is available at https://github.com/jgibson2/solar-wind-rec-scripts.
2.3.1 Solar and Wind Capacities in the United States
These gradient plots detail the solar and wind energy capacities in the United States, with a darker color indicating a higher capacity. It is immediately apparent from the maps that the resource distribution is nonhomogeneous across the country, with regions of high solar capacity predominantly in the southwest (e.g. New Mexico and Arizona) and regions of high wind capacity predominantly in the central US and on coastal regions.
2.3.2 Power Plant Capacities in the United States
This bubble chart plots the locations of power plants in the United States, with bubble area proportional to production capacity and colored by production type. Plants are clustered around major population centers and are predominantly located in the eastern US, along with Washington and California. In less populated areas, power is transmitted across long-distance, high voltage lines to customers.
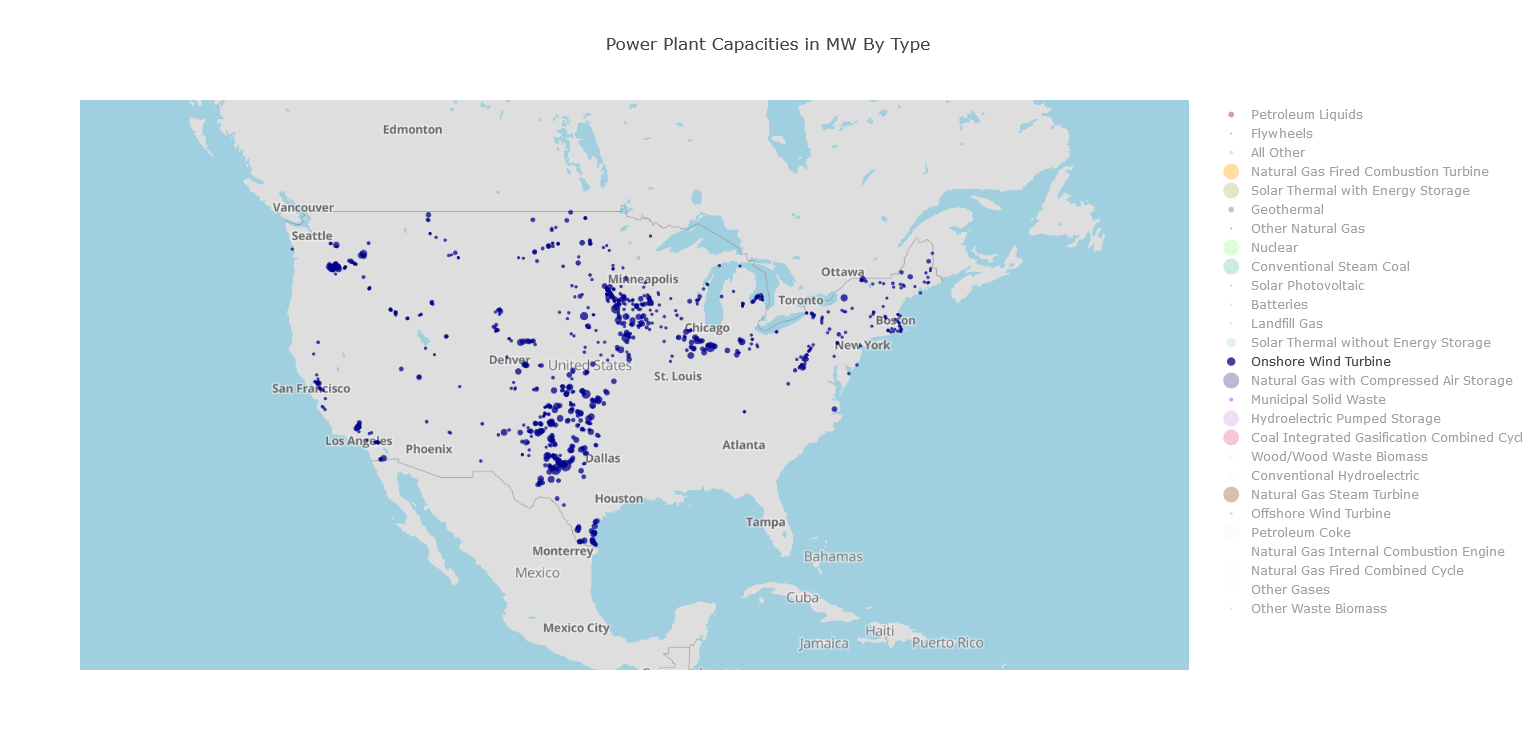
Figure 9: Onshore wind turbine locations. Data source: NREL.
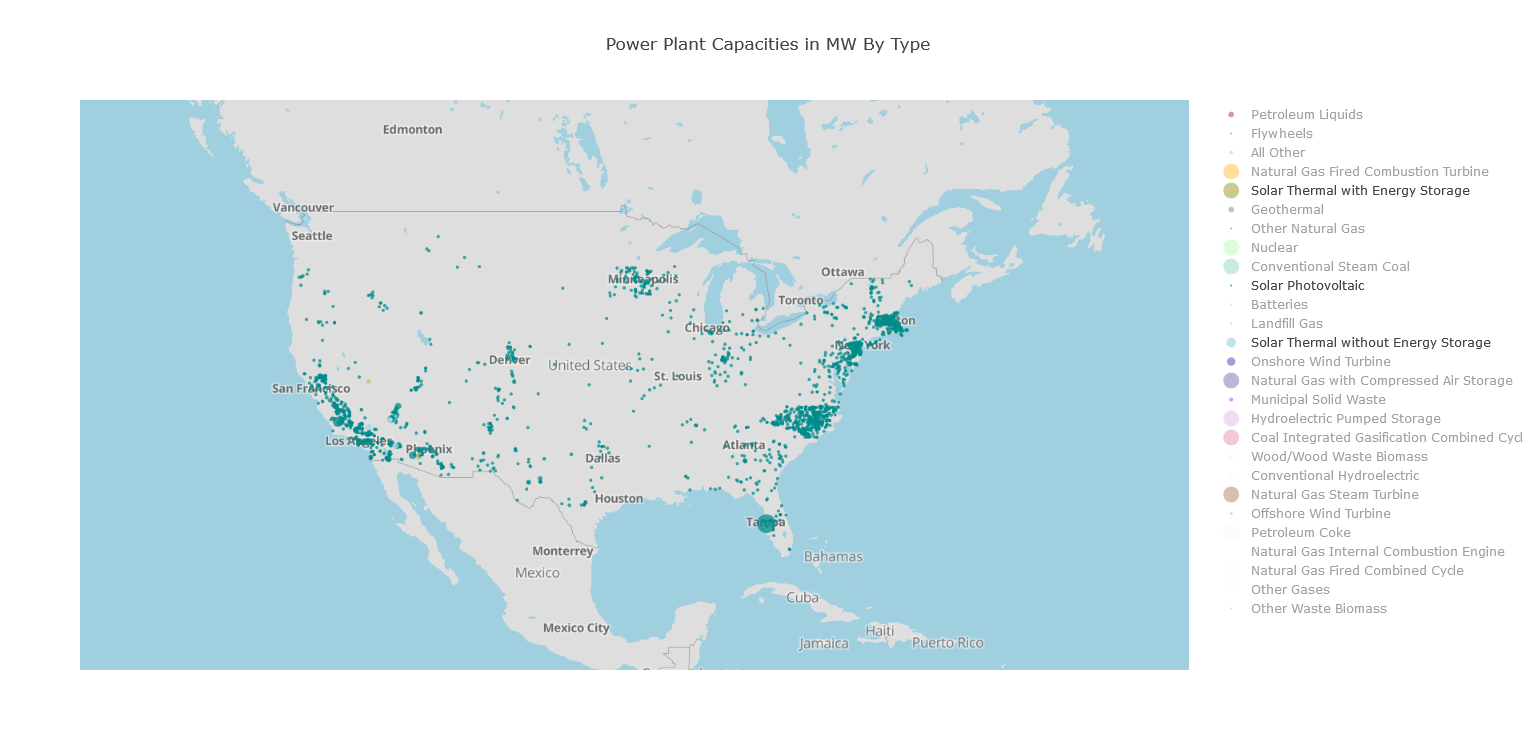
Figure 10: Solar power generation locations. Data source: NREL.
The above figures illustrate the distribution of wind and solar power generation, respectively. While wind generators are primarily located in regions of high wind capacity, solar photovoltaic cells are more widely distributed, though they tend to cluster in coastal regions and regions with high solar potential. This data, focusing only on industrial power generation, also does not take into account residential solar or wind installations, which are even more widely distributed. Regions with higher renewable generation of one type also tend to have more renewable technology of other types, even in regions that are only of average capacity for other renewable power types, indicating that buy-in to one renewable technology fosters development and implementation of other renewable technologies.
2.3.3 Solar and Wind Capacities Overlaid with Power Plant Capacities
Overlaying the power plant capacity and resource capacity datasets produces the above plot, which indicates the distribution of natural resources in relation to the existing power generation infrastructure. In general, regions of high wind capacity have some smaller wind turbines and wind farms, but a large majority of power generation still comes from traditional fossil fuels (e.g. natural gas and coal). The current leader in renewable energy production, Texas, has many ongoing projects and pilots, especially in wind energy. In regions with high solar potential, such as Arizona and New Mexico, many solar pilots and small photovoltaic installations are present, along with a handful of larger solar thermal energy plants. Most regions of high renewable capacity are located in the West, a region of lower population density and thus lower demand for electricity, causing resources to be untapped due to lack of market pressure. These resources are also part of the Western Interconnection, making renewably-generated power difficult to transmit to the more power-hungry Eastern Interconnection. Texas is similar: the independent nature of the interconnections makes power exchange with other grids economically and technologically infeasible. Interestingly, coastal cities on the West Coast underutilize their wind resources despite having high capacity for coastline and off-shore wind power generation, instead utilizing solar power. This may be due to the high price of coastal land near large cities and pushback from residents, making construction of wind resources infeasible, while solar arrays can be placed on top of buildings and are generally less obtrusive.
3 Recommendations
As the US continues to grow and expand, it will tax the aging grid until the point of failure.
Thus, it is imperative that the country undertake a modernization effort to improve the reliability of power generation, transmission, and distribution infrastructure. In addition, the rapidly changing climate and the exhaustible nature of fossil fuels dictates that the grid modernization include an increased reliance on renewable, inexhaustible energy sources. To this end, this report proposes policy changes and infrastructure developments to be implemented in the near future to facilitate the renovation of the power grid and the transition to renewable energy sources. In addition, it will recommend sites for implementation of renewable power generation.
3.1 Infrastructure
The primary obstacle to renewable power transmission and distribution is the independent nature of the interconnections. Though the western United States has the potential to generate enough renewable power to offset fossil fuel usage in the eastern US, the lack of easy and efficient power transmission from the Western Interconnection and Texas Interconnection to the Eastern Interconnection discourages power utilities from expanding and producing a renewable energy surplus for sale to the East. Therefore, the interconnections should be more strongly coupled and standardized to allow for cross-transmission of power. Implementing a carbon tax or other fossil fuel disincentive will then decrease the east’s use of fossil fuel plants and instead spur the generation of renewable energy in the west, which can then be sold across the interconnections. Not only does this proposal result in a shift to renewable energy, it also bolsters an economically struggling region of the country and creates jobs in the central and southwestern US.
In 2013, a company called Tres Amigas LLC developed plans for an electric superstation in Clovis, New Mexico, which would tie together the Western, Eastern, and Texas Interconnections with 5 GW links [13]. However, after a slew of delays and pushback from Texas lawmakers and utilities, the project was downsized and has still not been completed. This report recommends the implementation of the original Tres Amigas plan, which would increase cross-intersection power transmission by over 200%.
3.2 Technology Research and Development
To alleviate the temporal inconsistency of renewable power generation, this report recommends further investment into efficient energy storage technologies for use on both a national and local scale. Currently, only 2.5% of the energy generated by the US is capable of being stored, and the lack of energy storage presents a large obstacle to the adoption of renewable energies such as solar and wind power. Increasing the storage capacity will allow excess power to be saved and reused instead of wasted. This is critical, as power produced by renewable sources during the day will need to be stored and released during the night, when solar and wind generation are at their minima.
The development of localized microgrids can also offset the issues with renewable energy, as power can be more evenly distributed between users based on individual need. In addition, power transmission is more efficient on a local scale, and users who generate an excess of power can sell that power to connected neighbors for a profit. Microgrids also encourage the efficient use of power by consumers, promote local and community-organized installation of renewable energy sources, and decrease dependence on aging high-voltage transmission lines.
3.3 Policy
Though this report is primarily a recommendation on research, development, and implementation, a necessary part of these goals is policy development and updates. As such, this report recommends the following broad policies:
- Further incentives for renewable power usage, coupled with disincentives for fossil fuel consumption (i.e. a carbon tax).
- Support for grid modernization through policy initiatives.
- Governmental support and funding for connection of grid interconnections.
These policies are necessary for the continued improvement of the power grid due to the disparate nature of the companies currently responsible for generation, transmission, and distribution of power to consumers.
3.4 Renewable Power Development Locations
Furthermore, this report provides recommendations for increasing renewable energy usage in the following places:
|
Location
|
Action
|
Rationale
|
|
Denver, CO
|
Increase utilization of wind power
|
Denver is directly adjacent to the region of highest wind capacity. However, it instead uses predominantly solar and conventional coal-fired steam generators. Adding wind power would allow Denver to shut down dangerous plants like the Cherokee Coal Plant, which threatens the nearby river and downstream communities with heavy metal and fine particulate pollution.
|
|
Eureka, CA
|
Increase utilization of wind power
|
Eureka is located on one of the best locations on the Pacific coast for onshore and offshore wind power generation. Its proximity to San Francisco and Sacramento means that large wind farms in Eureka could also offset current production in those cities, where real estate is much more expensive.
|
|
Salt Lake City, UT
|
Replace steam coal and landfill gas plants with solar photovoltaic cells
|
Salt Lake City has been battling air pollution for decades, as the unique air layer inversions trap pollution in a low-hanging cloud over the city [14]. Removing old coal-fired and landfill gas plants and replacing them with clean solar energy will help alleviate Salt Lake City’s air pollution problem.
|
|
Honolulu, HI
|
Augment petroleum plants with solar and wind power
|
Around 75% of Hawaii’s energy comes from liquid petroleum power plants. As Hawaii has no fossil fuel reserves, the state must import all the petroleum it uses, resulting in the highest electricity prices in the United States [15]. Increased utilization of solar power would decrease costs to consumers and protect Hawaii’s natural environment from pollution.
|
3.5 Further Work
Further work is needed on modelling power outputs of renewable energy sources, as models for photovoltaic cells and wind turbines remain incomplete, and this report does not compute modelled power outputs of wind and solar power installations, merely capacity factors. In addition, more work is needed on modelling energy source output on a temporal scale to calculate needed energy storage capacity.
4 Conclusion
In light of the urgent need to modernize our power grid, this report provides analysis and recommendations for integrating renewable energy sources into the existing US power grid to offset the use of fossil fuels and improve power generation, transmission, and distribution. In addition, this report provides visualization tools for the exploration of power plant capacities and technologies and solar and wind resource distributions. These tools may be combined with domain-specific knowledge to generate plans for renewable energy integration on both a national and local scale. This report also provides multiple recommendations for infrastructure development, technology research and development, policy, and locations of regions with urgent need of renewable energy conversion; it can also be used as a basis for additional studies on optimal locations to install renewable energy technologies. Thus, this report provides the necessary first steps for developing a plan to fully transform the power grid into a reliable, efficient, environmentally-friendly system.
5 References
- "Number of U.S. Housing Units 2017 | Statistic." Statista, https://www.statista.com/statistics/240267/number-of-housing-units-in-the-united-states/. Accessed 20 Apr. 2019.
- "U.S. Renewable Energy Factsheet | Center for Sustainable Systems." Home, 1 Oct. 2019, http://css.umich.edu/factsheets/us-renewable-energy-factsheet.
- "1.2 Overview of the US Electric Power Grid." EBF 483 Introduction to Electricity Markets Geography Department Penn State, https://www.e-education.psu.edu/ebf483/node/4. Accessed 20 Apr. 2019.
- Clark, Meagan. "Aging US Power Grid Blacks Out More Than Any Other Developed Nation." International Business Times, 17 July 2014, https://www.ibtimes.com/aging-us-power-grid-blacks-out-more-any-other-developed-nation-1631086.
- Greenberg, Andy. "Hackers Gain Direct Access to US Power Grid Controls." WIRED, 6 Sept. 1706, https://www.wired.com/story/hackers-gain-switch-flipping-access-to-us-power-systems/.
- "National Renewable Energy Laboratory: Solar Has The Most Potential Of Any Renewable Energy Source." Think Progress Header Logo, 30 July 2012, https://thinkprogress.org/national-renewable-energy-laboratory-solar-has-the-most-potential-of-any-renewable-energy-source-87da2c774fcc/.
- Matasci, Sara. "How Solar Panel Cost & Efficiency Change Over Time | EnergySage." EnergySage, 4 Jan. 2019, https://news.energysage.com/solar-panel-efficiency-cost-over-time/.
- Photovoltaics and Electricity - Energy Explained, Your Guide To Understanding Energy. https://www.eia.gov/energyexplained/print.php?page=solar_photovoltaics. Accessed 20 Apr. 2019.
- Pernick, Ron, et al. "Clean Energy Trends 2012." Clean Edge, Mar. 2012, http://www.cleanedge.com/sites/default/files/CETrends2012_Final_Web.pdf.
- "Grid Data and Tools | Grid Modernization | NREL." Grid Modernization | NREL, https://www.nrel.gov/grid/data-tools.html. Accessed 20 Apr. 2019.
- "U.S. Grid Energy Storage Factsheet | Center for Sustainable Systems." Home, 1 Oct. 2019, http://css.umich.edu/factsheets/us-grid-energy-storage-factsheet.
- Dan Kaminsky, Chief. "Modern Analytic Apps for the Enterprise." Plotly, https://plot.ly. Accessed 20 Apr. 2019.
- "Tres Amigas." Logo, http://www.tresamigasllc.com/index.php. Accessed 20 Apr. 2019.
- Inversions - Division of Air Quality - Utah Department of Environmental Quality. https://deq.utah.gov/legacy/pollutants/p/particulate-matter/inversions.htm. Accessed 20 Apr. 2019.
- "Hawaii: An Energy and Economic Analysis - IER." IER, 25 June 2013, https://www.instituteforenergyresearch.org/fossil-fuels/coal/hawaii/.
- "2013 Reliability & Markets Peer Review - Day 1 Presentations." Energy.Gov, https://www.energy.gov/oe/downloads/2013-reliability-markets-peer-review-day-1-presentations. Accessed 20 Apr. 2019.
- Bakke, Gretchen. "Aging And Unstable, The Nation’s Electrical Grid Is ‘The Weakest Link.’" NPR.Org, 22 Aug. 2016, https://www.npr.org/2016/08/22/490932307/aging-and-unstable-the-nations-electrical-grid-is-the-weakest-link.
- "Continental U.S. Power Transmission Grid - Wikipedia." Wikimedia Foundation, Inc., 2 May 2018, https://en.wikipedia.org/wiki/Continental_U.S._power_transmission_grid.
- "History of Electricity - IER." IER, 20 Apr. 2019, https://www.instituteforenergyresearch.org/history-electricity/.
- How Electricity Is Delivered To Consumers - Energy Explained, Your Guide To Understanding Energy - Energy Information Administration. 31 Aug. 2018, https://www.eia.gov/energyexplained/index.php?page=electricity_delivery.
- Newman, Lily. "The Hail Mary Plan to Restart a Hacked US Electric Grid." WIRED, 14 Nov. 1807, https://www.wired.com/story/black-start-power-grid-darpa-plum-island/.
- "Preliminary Monthly Electric Generator Inventory (Based on Form EIA-860M as a Supplement to Form EIA-860)." U.S. Energy Information Administration - EIA - Independent Statistics and Analysis, 16 Apr. 2019, https://www.eia.gov/electricity/data/eia860m/.
- Solar Resource Data API | NREL: Developer Network. https://developer.nrel.gov/docs/solar/solar-resource-v1/. Accessed 20 Apr. 2019.
- "U.S. Electric System Operating Data." U.S. Energy Information Administration - EIA - Independent Statistics and Analysis, 16 Apr. 2019, https://www.eia.gov/realtime_grid/#/data/graphs?end=20190102T00&start=20181226T00.
- S. Energy Facts - Energy Explained, Your Guide To Understanding Energy - Energy Information Administration. 16 May 2019, https://www.eia.gov/energyexplained/?page=us_energy_home#tab3.
- Xiarchos, Irene, and William Lazarus. "Factors Affecting the Adoption of Wind and Solar-Power Generating Systems on U.S. Farms: Experiences at the State Level." United States Department of Agriculture, July 2013, https://www.usda.gov/oce/reports/energy/WindSolar_Web_08162013.pdf.